OOH advertising has changed. It’s no longer just about getting your name out there and hoping for the best. Today, smart advertisers want proof: Who saw it? What did they do next? Did it actually work?
This is your no-fluff, straight-talking guide to measuring Out-of-Home advertising in 2025 – with the tools, tactics and benchmarks that actually matter.
Start with One Question: What Does Success Look Like?
Before you start measuring anything, figure out what you’re trying to achieve.
- Brand awareness? You’re looking at reach, impressions, and share of voice.
- Footfall? Track how many people head into your store, gym or venue post-campaign.
- Online action? Look for search uplift, web traffic, QR code scans or app downloads.
- Sales? Promo code redemptions, voucher use, or conversion uplift.
You can’t track everything. Focus on what matters most for the business outcome you want.
Understand the Key OOH Metrics (And What They Actually Mean)
Impressions
Impressions = total number of views. Sounds simple, but it’s modelled — not counted. It’s based on factors like traffic volume, footfall, visibility (how long people see the ad), and format.
A roadside billboard might generate 350,000 weekly impressions. A 6-sheet near a busy tube station could deliver 95,000, but with higher dwell time.
Not all impressions are created equal.
Reach & Frequency
Reach = number of unique people who see the ad.
Frequency = how often they see it.
High reach is great for awareness. Frequency builds memory.
Dwell Time
How long someone stays in view of your ad. Important for DOOH, street-level formats, and flyposting.
CPM (Cost per Thousand Impressions)
Your cost to reach 1,000 views. Use this to benchmark across formats or against digital spend.
| Format | Avg UK CPM |
|---|---|
| Digital 6-sheet | £6–£12 |
| Roadside Billboard | £8–£14 |
| Classic Flyposting | £1–£3 |
Use Mobile Location Data to Track Movement
We use anonymised mobile data from partners like Adsquare, Tamoco and Vistar to see how people move in the real world.
Here’s what we track:
- Dwell time near an OOH site
- Footfall into stores or venues after exposure
- Audience profile (age, affluence, behaviours)
- Where people go before and after seeing an ad
It’s GDPR-compliant, panel-based, and gives us insight into whether people who saw your ad took real-world action.
And yes, it works for classic and digital formats.
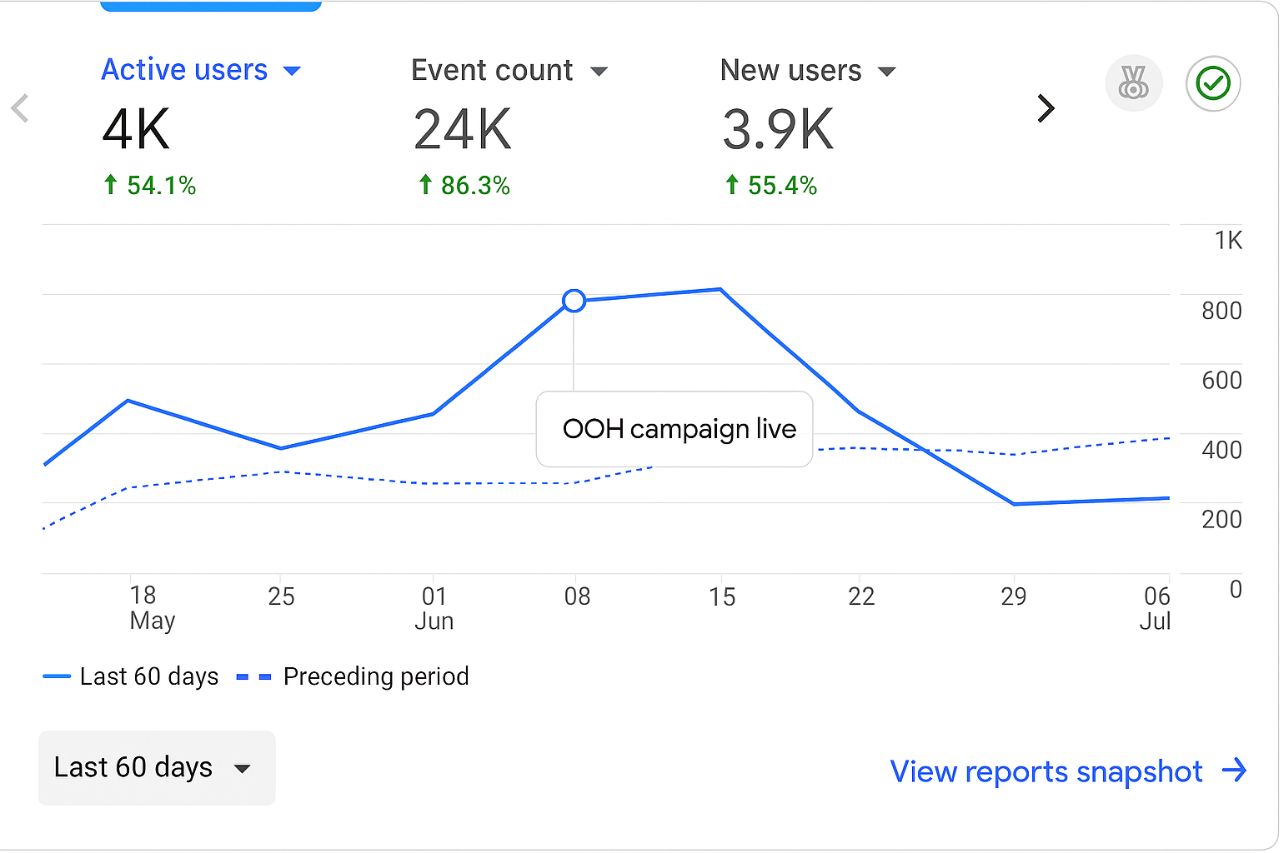
Track What Happens Online: Post-Exposure Uplift
OOH doesn’t get clicks. But it drives action.
Watch for these signals:
- ↑ Direct traffic to your site (esp. from campaign regions)
- ↑ Brand search volume on Google
- ↑ App installs or app opens
- ↑ QR code scans, promo code redemptions
- ↑ Unique URL visits (we recommend using UTMs)
Use GA4, AppsFlyer or Branch to geo-segment data and match uplift to the campaign footprint.
We often see +20-40% uplift in search interest when a strong OOH creative goes live
Attribution: Proving What Worked
This is where it gets smart. Attribution tools help connect the dots between exposure and outcome.
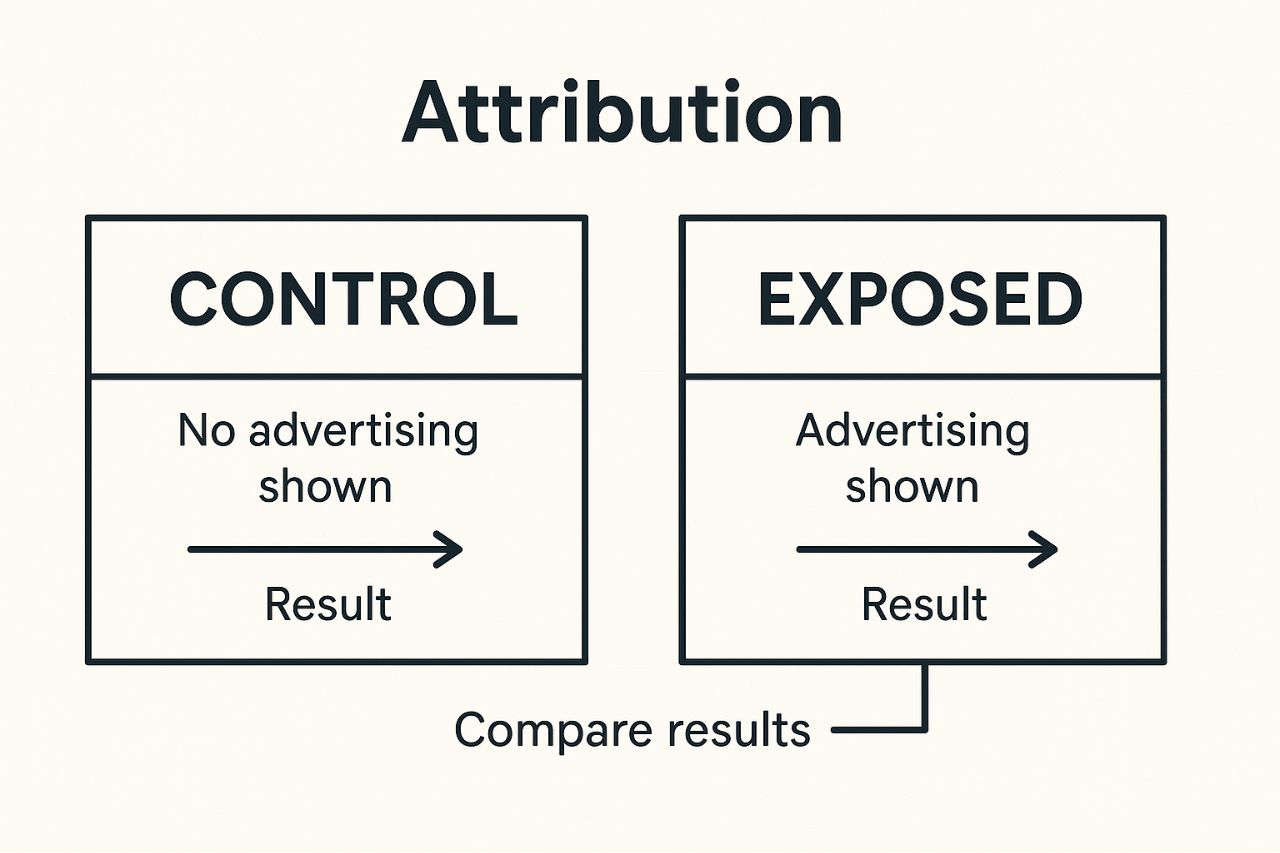
Control vs Exposed Testing
We compare audiences who were exposed to the ad (e.g. lived or travelled through activation zones) with matched groups who weren’t.
Then we look for differences in:
- Store visits
- App activity
- Web behaviour
- Purchase data
If the exposed group outperforms, we can reasonably say: OOH played a role.
Attention Metrics
For DOOH, tools like Quividi measure:
- Number of actual viewers
- Gaze time (did they really look?)
- Age/gender of the viewer
Good creative makes a big difference here.
Use the Right Tools (And Know What They Do)
| Tool | What it Measures |
| Route | UK standard for OOH impressions & reach |
| Geopath | US equivalent to Route |
| Quividi / AdMobilize | Viewer attention & gaze tracking (for DOOH) |
| Tamoco / Adsquare | Location data, footfall, audience profiling |
| GA4 / Branch | Online action, app activity, post-exposure uplift |
We often layer these together into one smart dashboard.
Bring It All Together: Real Client Examples
These anonymised case studies show how we measure success in the real world – and how OOH drives clear, measurable results.
Health Brand Launch
A new protein brand needed mass reach on a budget.
National campaign across digital billboards, bus wraps, and tube panels
Timed for January fitness push, focused on gym-heavy areas
Result: 21M+ adults reached, 200% surge in web traffic, strong uplift in key cities
Pet Food Near Retail
Premium pet food brand wanted to test OOH and drive store sales.
Digital screens near Tesco/Sainsbury’s across London
“100% Natural” creative targeting premium buyers
Result: 168% of target impressions, sales uplift during and after promo
Sport Event Build-Up
Global sports brand promoting ticket sales for a UK event.
100 branded taxis with QR codes, launched 100 days before event
Result: Boosted ticket sales and brand visibility in new market
These are just a few examples of how we plan, track, and prove impact — and how OOH goes beyond just impressions.
Common Pitfalls to Avoid
Tracking impressions, but ignoring creative quality
Not benchmarking CPMs properly
Using the same KPIs for classic and DOOH
Forgetting to track post-exposure uplift
Overcomplicating reports with vanity metrics
Final Word: You Can’t Optimise What You Don’t Measure
OOH is more measurable than ever. But only if you set it up properly.
With the right goals, the right tools, and the right creative, you can prove that OOH isn’t just high impact – it’s high performance.
Want help measuring your next campaign? Drop us a line – we’ll help you make it count.

